Fight or Flight Therapy
Questionaire
The Fight or Flight Questionnaire
This questionnaire will help you better understand what symptoms you have that may be caused by your nervous system being stuck in
fight-or-flight. These are the exact same symptoms and difficulties that can markedly improve, or simply disappear, with
Fight or Flight Therapy.
FREE ANALYSIS
Click the download link above and take a few minutes to grade each question 0-5. Then add up your total score.
After completing your questionnaire, here is a link for a
FREE analysis of your score. Attach your questionnaire to the following email link:
Link to send for free analysis:
drtessler@FightorFlightTherapy.com
Ask yourself:
what would your life look like? if your score were cut in half, or even less.
In most cases, that is a very achievable goal with
Fight or Flight Therapy.
Hard to believe?
See the graph below and contact us for more information. Link To Contact Page
Measurable Results
The following graph demonstrates the uncommon success of Fight or Flight Therapy.
Using symptom scores on the Fight or Flight Questionnaire:
The RED
curve demonstrates scores
BEFORE Fight or Flight Therapy.
The
GREEN curve demonstrates scores
AFTER Fight or Flight Therapy.
Any shift of the graph to the right would indicate improved quality of life.
Note how dramatically the scores reduced!
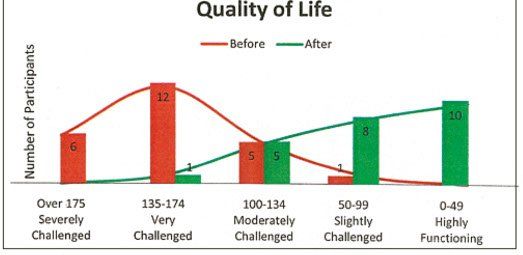
The graph above demonstrates self-scored symptom improvement for 24 consecutive clients who met all criteria for data collection.
Each participant filled out The Fight or Flight Questionnaire
before commencing, and after completing,
their program of Fight or Flight Therapy. Each symptom or behavior was graded on a scale of 0-5 in
terms of severity or degree of difficulty, with the worst possible score being 350.
Note: each participant improved, with the least improvement being 19 points, and the most being 251.
The average percent reduction in score was 58%, with the median reduction being an impressive 62%.
303-744-6508
drtessler@FightorFlightTherapy.com
© Fight or Flight Therapy, llc
The Fight or Flight
Questionaire
Is Flight or Flight Therapy right for you?
These area a sampling of symptoms common to people stuck in fight-or-flight.
How many symptoms do you have?
You might be surprised, or maybe you will confirm what you already suspect.
How many symptoms do you have?
You might be surprised, or maybe you will confirm what you already suspect.